


This guide explains how to safely enable WordPress Debug Mode, locate and analyse debug logs, troubleshoot common issues, and disable debugging once your investigation is complete.
When a WordPress website experiences unexpected behaviour, such as error messages, broken functionality, blank pages, plugin conflicts, or failed updates, identifying the root cause can be challenging. Fortunately, WordPress includes a built-in troubleshooting feature called Debug Mode that helps website owners and developers diagnose issues more effectively.
WordPress Debug Mode records technical information generated by WordPress core, plugins, themes, and custom code. This data can help identify errors, warnings, notices, and compatibility issues that may not otherwise be visible.
While Debug Mode is a powerful troubleshooting tool, it should be used carefully, especially on live websites. Displaying errors publicly can expose sensitive technical information, including file paths, plugin names, and server configuration details. For this reason, private logging is generally recommended instead of displaying errors to visitors.
TABLE OF CONTENTS
What Is WordPress Debug Mode?
WordPress Debug Mode is a built-in diagnostic feature that records PHP errors, warnings, notices, and development messages generated by WordPress and its components.
The feature is controlled via the WP_DEBUG constant in the WordPress configuration file and can be combined with additional settings to log errors privately without displaying them to website visitors.
When Should You Use WordPress Debug Mode?
Debug Mode can be useful when:
- A website displays an unexplained error message.
- A plugin or theme causes unexpected behaviour.
- A recent update breaks website functionality.
- The website shows a blank page or critical error.
- Contact forms or checkout pages stop working.
- Custom code is being tested or developed.
- A developer requires additional diagnostic information.
WordPress Debug Mode vs Error Logs
Although often used together, Debug Mode and error logs are not the same thing.
- WordPress Debug Mode: Debug Mode enables diagnostic reporting within WordPress.
- WordPress Debug Log: The debug log stores messages generated by Debug Mode so they can be reviewed later.
- PHP Error Logs: PHP error logs are separate server-level logs that may capture errors affecting WordPress and other PHP applications hosted on the same account.
Before You Begin
Before enabling Debug Mode, ensure you have:
- WordPress administrator access.
- Access to your Domains.co.za hosting account.
- Access to File Manager or SFTP.
- A recent full website backup.
- A copy of the existing wp-config.php file.
- A staging environment where possible.
- Details of the issue you are investigating.
- Notes regarding recent website changes or updates.
Important Safety Warning
Debug information should never be displayed publicly on a live website. Error messages can expose sensitive technical details that may assist malicious users.
For production websites, private logging should always be used instead of displaying errors on the front end.
Method 1: Enable Debug Mode Using wp-config.phpMethod 1: Enable Debug Mode Using wp-config.php
This is the standard method that most WordPress administrators and developers use.
Step 1: Access Your Hosting Control Panel
1. Login to the Domains.co.za Customer Portal.
2. Open the Manage Services drop-down menu.
3. Select Web Hosting.
4. Click Manage next to the hosting package associated with your domain.
5. Click Login next to Control Panel to access cPanel.
Step 2: Open the WordPress Files
1. Open File Manager from cPanel.
2. Navigate to your WordPress installation directory.
In most cases, this will be the public_html folder, although some websites may store configuration files outside the public root.
Step 3: Locate wp-config.php
- Find the file named wp-config.php.
- Confirm that it belongs to the correct WordPress installation.
Step 4: Create a Backup
1. Download a copy of wp-config.php.
2. Alternatively, create a duplicate copy within File Manager before editing.
Creating a backup allows you to restore the original configuration if required.
Step 5: Locate the Existing Debug Settings
Search the file for:
define( 'WP_DEBUG', false );If the setting already exists, edit it rather than creating a duplicate entry.
Step 6: Enable Debugging & Private Logging
Update the configuration as follows:
define( ‘WP_DEBUG’, true );
define( ‘WP_DEBUG_LOG’, true );
define( ‘WP_DEBUG_DISPLAY’, false );
@ini_set( ‘display_errors’, 0 );
These settings perform the following functions:
- WP_DEBUG enables WordPress debugging.
- WP_DEBUG_LOG records messages in a log file.
- WP_DEBUG_DISPLAY prevents errors from appearing publicly.
- display_errors prevents PHP errors from displaying on the website.
SECURITY TIP:
By default, WordPress stores debug logs in /wp-content/debug.log, which may be publicly accessible depending on server configuration. For improved security, advanced users can store the log outside the public website directory by specifying a custom log path.
Step 7: Save the File
1. Save the updated wp-config.php file.
2. Close the editor.
Step 8: Reproduce the Error
WordPress only records errors that occur after debugging has been enabled.
Repeat the action that triggers the issue, so the relevant information is added to the log file.
How to Find the WordPress Debug Log
Step 1: Open File Manager
1. Return to File Manager.
2. Navigate to the wp-content folder.
The default WordPress debug log location is:
/wp-content/debug.logIf you configured a custom log path, the file will be stored in the location specified in the WP_DEBUG_LOG setting instead.
Step 3: Download the Log
Download a copy of the log before editing, clearing, or deleting it.
Step 4: Check Permissions if the Log Is Missing
If the log file does not appear:
- Verify that WP_DEBUG_LOG is enabled.
- Ensure WordPress has permission to write files.
- Contact Domains.co.za Support if file permissions are unclear.
How to Read the WordPress Debug Log
- Match the Timestamp: Compare the recorded timestamp with the approximate time the issue occurred.Remember that timestamps may be recorded in UTC rather than South African local time.
- Prioritise Fatal Errors: Fatal errors usually stop pages, plugins, themes, or entire websites from functioning. These should generally be investigated first.
- Review Warnings and Notices: Warnings and notices often indicate outdated or poorly written code but may not be the direct cause of the problem.
- Examine File Paths: File paths can help identify the source of an issue. Examples include:
- /wp-content/plugins/
- /wp-content/themes/
- WordPress core directories.
- Look for Repeated Entries: Repeated errors often indicate unresolved conflicts or recurring failures.
Method 2: Enable Debug Mode Using a Plugin
Some users prefer not to manually edit wp-config.php.
1. Login to the Domains.co.za Customer Portal using your account credentials.
2. Navigate to Manage Services from the dropdown menu.
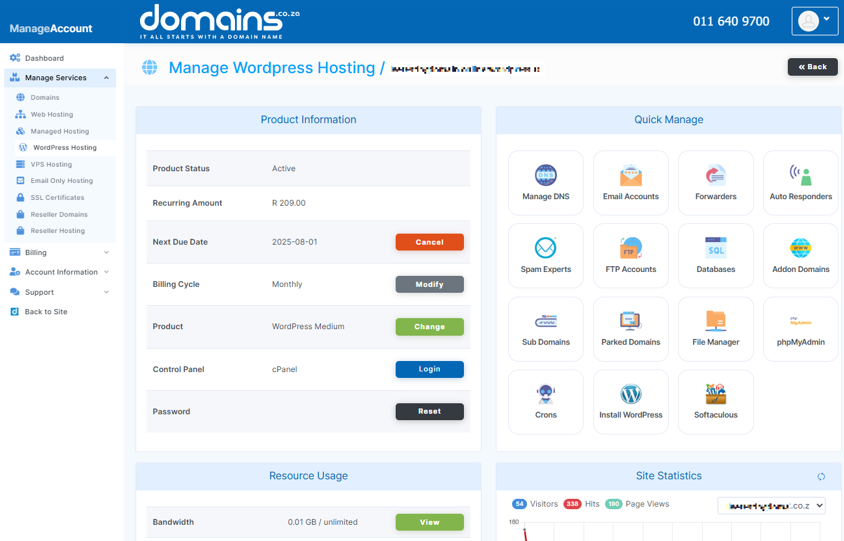
3. Select your WordPress Hosting package and click Manage.
4. Click Login to cPanel to access your hosting control panel.
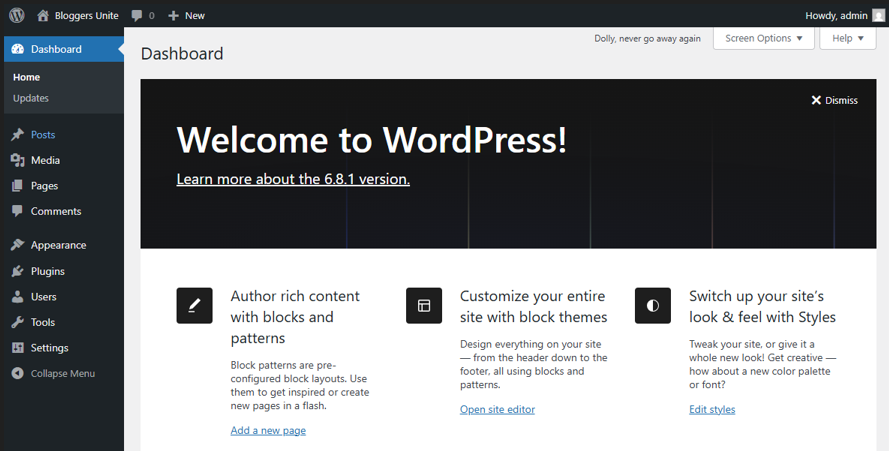
5. Open the WordPress Admin Dashboard.
6. Navigate to Plugins > Add New Plugin.
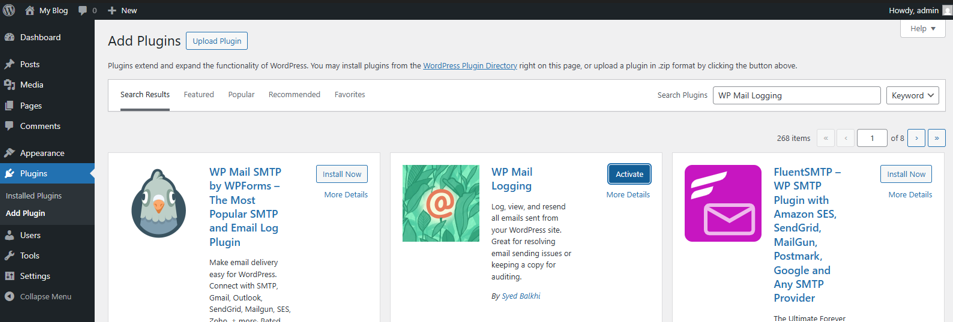
7. Search for a debugging tool such as WP Debugging or Query Monitor.
8. Review compatibility, maintenance history, and user feedback.
9. Click Install Now.
10. Click Activate once installation is complete.
11. Use the plugin to review debugging information and investigate the issue.
12. Temporary diagnostic tools should not remain active unnecessarily.
Understanding SCRIPT_DEBUG
SCRIPT_DEBUG is a separate debugging option that loads development versions of WordPress JavaScript and CSS files.
SCRIPT_DEBUG is useful when troubleshooting:
- JavaScript errors.
- Front-end functionality problems.
- CSS-related issues.
- WordPress development projects.
Add the following line to wp-config.php:
define( 'SCRIPT_DEBUG', true );Disable SCRIPT_DEBUG Afterwards
Once troubleshooting is complete, return the setting to false to maintain optimal website performance.
WordPress Debug Log vs PHP Error Log
- WordPress debug.log: Captures WordPress-specific debugging information when WP_DEBUG_LOG is enabled.
- PHP error_log: This captures server-level PHP errors and may include issues affecting other applications on the hosting account.
- PHP Log Locations: The location of PHP logs varies depending on the hosting environment and server configuration. Logs may be accessible through cPanel, a logs directory, or another designated location.
Investigating Database Errors Safely
When troubleshooting database-related issues:
- Use debug logs and diagnostic tools.
- Review plugin-related database errors.
- Consult Domains.co.za Support when necessary.
Never edit WordPress core files such as class-wpdb.php to enable debugging or database reporting.
Core modifications are unsafe and will be overwritten during updates.
Fixing Common Errors Revealed by Debug Mode
- Verify compatibility with your WordPress version.
- Update the plugin.
- Test deactivation in a staging environment.
- Contact the plugin developer if required.
- Update the theme.
- Test with a default WordPress theme.
- Review child-theme customisations.
- Contact the theme developer.
- Deprecated Code Notices: These messages indicate code that may become incompatible with future WordPress or PHP versions.
- Memory Exhausted Errors: Investigate resource usage and the underlying cause before increasing memory limits.
- Database and Server Errors: Contact Domains.co.za Support or a qualified developer if errors relate to permissions, connectivity, server resources, or PHP configuration.
How to Disable WordPress Debug Mode
Once troubleshooting is complete, return your configuration to:
define( 'WP_DEBUG', false );
define( 'WP_DEBUG_LOG', false );
define( 'WP_DEBUG_DISPLAY', false );
define( 'SCRIPT_DEBUG', false );
Remove or Archive the Debug Log: Download any useful records before deleting or archiving large log files.
Clear Website Cache: Clear any website, plugin, CDN, or server cache to ensure visitors receive updated content.
Test the Website After Debugging
Verify that:
- The homepage loads correctly.
- Important pages function normally.
- Contact forms submit successfully.
- User login functions correctly.
- WooCommerce checkout works as expected.
- Mobile layouts display properly.
- No technical errors appear publicly.
- Tracking and integrations remain operational.
- The same recurring error no longer appears in the logs.
When to Contact Domains.co.za Support or a Developer
Seek assistance if:
- You cannot access WordPress or hosting files.
- Fatal errors continue after troubleshooting.
- Database connection issues persist.
- Server errors continue to occur.
- Malware is suspected.
- Customer transactions are affected.
- The logs are difficult to interpret.
- PHP or server configuration changes are required.
Additional Information
- WordPress Debug Mode provides diagnostic information but does not automatically identify or fix problems.
- Debugging should be performed in a staging environment whenever possible.
- Only errors generated after debugging is enabled will appear in the debug log.
- Public error display can expose sensitive information and should not be used on live websites.
- Large debug logs can consume storage space and may affect performance if left unmanaged.
- WordPress debug logs and PHP error logs serve different purposes and may contain different information.
- Duplicate WP_DEBUG settings can cause configuration issues and should be avoided.
- SCRIPT_DEBUG is intended for development and advanced troubleshooting rather than everyday website management.
- Backups should always be created before editing configuration files.
Login to Domains.co.za Account
1. Go to the Domains.co.za website Account Login page.

2. Enter your Email and Password and click the Sign In button.
3. You will see the Domains.co.za Dashboard, displaying the Manage Account menu on the left and your Account Information, Account Overview and Open Support Tickets on the right.


